Show and Tell! Great Graphs and Smart ChartsAn Introduction to InfographicsBy:Stuart Murphy / Illustrated by: Teresa Belln Let's get graphing!Want to find the most popular meal in the cafeteria? Compare town sports enrollments? Or maybe you just want to kn
![]()
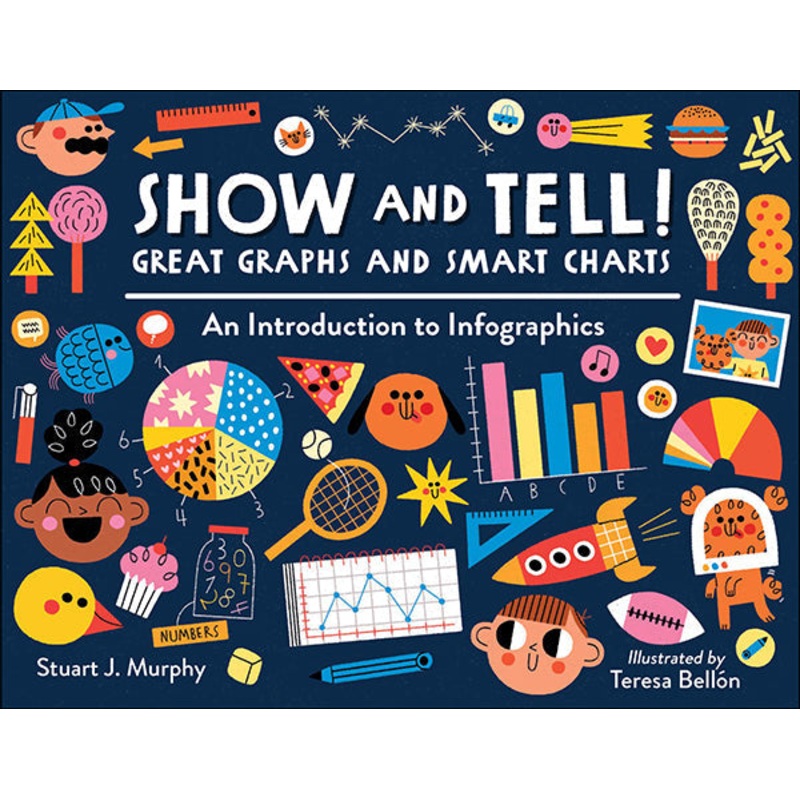
By:Stuart Murphy / Illustrated by: Teresa Belln
Want to find the most popular meal in the cafeteria? Compare town sports enrollments? Or maybe you just want to know who burps the most in your family! Learn what line graphs, bar graphs, pie charts, and pictographs are and how and when to use them to represent data.
Each project shows how to build a chart or graph and ties it all together with a creative infographic that really puts the A in STEAM (Science, Technology, Engineering, ARTS, and Mathematics). Whether used as an introductory aid or to underscore previous knowledge, the book prepares today’s visually savvy children to succeed in school and life by analyzing the world around them.
If you like this book, youll enjoy these:
Sir Cumference and the Off-the-Charts Dessert
Eat Your Math Homework
[TABS]
Download the Cover
Stuart Murphy, author
S tuart J. Murphy is a visual-learning specialist and the author of the I See I Learn series and the award-winning MathStart series. He has also served as an author and consultant on a number of major educational programs. Stuart lives in Boston, Massachusetts.
Read more about Stuart.
Teresa Belln, illustrator
A native of Spain, Teresa Belln is an artist and illustrator inspired by travel and walks in her hometown of Madrid.
Read more about Teresa.
School Library Journal
A project-based introduction to graphs and charts is presented with bold illustrations and engaging text as Murphy brings his wealth of kid-friendly math expertise to the world of infographics. Two classmates, a Black girl and a white boy, navigate each type of graph or chart. They explore bar graphs, pictographs, pie charts, and line graphs. With each one they focus on a real-world topic such as favorite meals, burps in a week, most common household pets in their school, and amusement park rides. Each chapter clearly explains how to gather the data, track the data on a table, and then transfer that information on to the appropriate type of visual. Dialogue bubbles between the two students add humor, while side bars show them extending the collection and interpretation of data. This title could be used as an introduction or as a refresher depending on the age group. Younger students might need a bit of front-end work with vocabulary definitions for words such as data, trend, and diagram. The book ends with suggestions for creating a personal infographic, combining many of the charts and graphs explored in the book.
VERDICT This STEAM title is a valuable purchase where math and literary nonfiction are in demand.
Children’s Literature
Here is the perfect book for elementary school students who find themselves with a need to gather and share information. Whether its Science Fair time or a math unit focused on data, this quick to read and easy to understand book provides essential guidance that helps readers get right to number-cracking and infographics design! After explaining what infographics are and how they help to present data in an easy to digest way, author and visual-learning specialist Murphy goes through each of several types, including bar graphs, pie charts, line graphs, and pictographs. He explains how readers who want to know something (like whats the most popular meal among family and friends, or how many times family members burp in a week) can collect and tally the data, then create a bar graph or other appropriate visual. He reminds readers to add labels and a title, and a call-out suggests adding appeal by adding art to the graphic. The results really pop! The final paragraph reminds readers that infographics can be used for many information-sharing tasks, even those that rely less on data, such as a self-portrait or visual biography. A dozen additional ideas for infographic subjects are provided at the end. Spanish illustrator Belln adds fun to this book by using bold colors and filling blank space with eye-catching graphics. A boy (lighter skinned) and girl (darker skinned) appear on each page, adding speech-bubble comments about the content. Data sharing is sure to feel less dry and less daunting for readers who complete this book! Recommended for elementary school classrooms and libraries.
Hardcover
ISBN: 978-1-58089-823-2
Paperback
ISBN: 978-1-62354-175-0
E-book
ISBN: 978-1-63289-711-4
Ages:7-10
Page count: 48
11 x 81/2
[/TABS]
Reviews
There are no reviews yet.